Summary
Read Full Post.....
Added to my Goldman Sachs Group, Inc. (NYSE: GS) position on the breakout above 140 as per plan. However, the sellers showed up later, and the broad based weakness led to Goldman Sachs selling off. I exited my full position at breakeven (140). Will probably need a couple days to determine whether there is any buy support at 136.6.
Started a 1/4 position in Berkshire Hathaway Inc. (NYSE: BRK.B) as per plan.
long 75.6, stop 73, target 80+
IBM (International Business Machines Corp., NYSE: IBM) has been acting the strongest during this OpEx selloff, along with MacDonald's. I will look to buy both names on weakness.
Another name has caught my eye, and that is American Capital Agency Corp. (NASDAQ: AGNC). This is a mortgage REIT that buys MBS's and CDO's and makes money on the interest rate spread. They pay a 21% dividend. They recently completed a secondary stock offering, which was priced at $25.75. I will monitor this stock to see if it can stay above 25.1 next Friday.
Tuesday, May 18, 2010
Trade Update, May 18, 2010


Monday, May 17, 2010
Trade Update
Goldman Sachs !!
Read Full Post.....
I only went long half of a position in Goldman Sachs (NYSE: GS) on the afternoon break above 140. I only took a half position because I believe there will be a re-test of the 138.5 lows. However, I recognize that I could be wrong, therefore, I needed to execute as per my previously described trade plan, but with reduced risk.
My stop is 139.5.
GS broke back above the 141.5 resistance level and even closed above that level, but is not out of the woods yet by any menas.
This week should tell us whether Goldman Sachs is trying to build a base at these levels (138-139).
As for my Visa Inc (NYSE: V) trade (bought 76.5, sold 78.9), I am glad the market offered me the opportunity to get out this morning. I timed my sell pretty near the Highs of the Day. That huge gap down indicates a big overhang of stuck longs, so there is no reason to look at swinging long Visa for the next few weeks until at least it can build a good base.
sold visa
Summary
Read Full Post.....
sold Visa Inc. (NYSE: V) at 78.9.
Thought about waiting for a last gasp exhaustion break above 79, but was too busy watching Baidu, so I bailed 78.9 good enough...
Friday, May 14, 2010
bought visa again
Summary
Read Full Post.....
bought back visa at 76.5
stop 75.65
target 81-82
hold over the weekend unless i get stopped out
exited longs
out Visa (NYSE: V) at 77, will wait for better entry on Visa to swing long
Still holding BIDU, raising sell stop to 72.5
Update:
Exited BIDU 73.35.
Currently no positions.
Was hoping for some buying strength into the close, I don't think that's going to happen.
Wait for next week to see if buyers show up.
Get Ready to Buy - Update part II
bought BIDU, and V
Read Full Post.....
In my previous post, I discussed a list of stocks that I planned to buy on a correction. One stock in my previous post has triggered, and I bought another which I did not previously discuss.
Long Visa (NYSE:V) 76.67
stop 74.5
target 81-82
Long Baidu (NASDAQ:BIDU) 72.83
stop 70
target 79
Saturday, May 10, 2008
Fairfax Financial Holdings Limited (NYSE:FFH)
Read Full Post.....
Ok, so even if you throw away the fact that I only discovered the ascending triangle pattern AFTER I had placed the trade, there's some other interesting things about that chart when I was looking at it at that time which made decide to buy it:
So, I felt that there was a high probability of a reversal at hand based on the above three technical reasons. After I bought, I was discouraged to see it drop further below my entry point. But I was encouraged to see no follow through to the initial sell-off. That was key to my decision to hold on to the trade. It also helped to not micromanage my trade, nor monitor my trade every 3 seconds. As the trading session unfolded, it became more and more apparent to me that 276 was going to be the day's bottom. I held on, and flipped it the next day, +1R profit.
Friday, May 09, 2008
Flip #2: Fairfax Financial Holdings Limited (NYSE:FFH)
Read Full Post.....
I made another flip trade, this time in Fairfax Financial Holdings Limited (USA) (NYSE: FFH). Bought yesterday (too soon) on the TSX exchange at 280.38 CAD, then flipped it today at 285 CAD.
Though it looks like I made some decent money, I was also risking a lot of money, so in terms of risk, I made less than 1R. All those traders who live and die by the religion of how much money they put at risk in a trade are overlooking one key factor. I have developed my own theory about risk, and it involves the notion that risk is not only about the size of your stop, but it is also about the probability of an event happening. If I risk 1R (where R=amount of dollars risked) on a trading pattern that has 51% success rate, then I make ((51wins - 49loss)/100) ==> 2% of 1R over time. However, if I risk 0.5R on a trading pattern with a 75% success rate, then I make 50% of 0.5R over time. So with the probabilities in my favour, I can risk less and still attain better results. And to take it one step further, if I know I have a high probability play, then I can risk more, which is what I did with my FairFax flip. I'll make another post (complete with a chart) explaining in more detail as to why I felt the FFH flip was a high probability play.
Anyways, I should post these trades in real time to make it more legit, instead of after the fact. But it is what it is.
Saturday, January 26, 2008
Trade Update on Ultra QQQ ProShares (AMEX:QLD)
Summary
Read Full Post.....
As mentioned previously, I bought Ultra QQQ ProShares (ETF) (AMEX:QLD) back on Wednesday @68.
On Friday, I sold it when it broke below 73 the second time in the afternoon session. I could have, and should have sold it when it was trading at 78 in the morning, but I didn't pull the trigger.
The main problem was that I did not have an exit strategy. I think I've got a handle on picking the right time to get into the trade, but I don't put as much time and focus into figuring when to exit the trade.
Wait the for the pop from the FOMC meeting? Fade the gap? Move stop to breakeven and let the profits fall where they may? Look for a break of trend? All of the above thoughts were floating in my head and as a result I was unable to make a decision.
Obviously for the next trade, I will have to work out an exit strategy.
Monday, October 22, 2007
Euro Trade
Summary
Read Full Post.....
I put a short in the Euro last night. With my stop in place, I reviewed what I just did to ensure that I was comfortable with and accepting of how much I was risking (that is the only way for me to sleep through the night with a futures trade in place). This morning, I woke up to find that I am still short and sitting on a nice gain.
Yes, I fluked out, and pretty much timed the top in the Euro. But now I am not sure what to do. Hold through the inevitable retrace and try to make this a real swing trade, or take my profits now ?
Regardless, I moved my stop down to 1.422 while I contemplate my options.
Tuesday, October 02, 2007
Natural Gas Trade
Read Full Post.....
This morning, I went long QGX7 @7.175, stop = 7.15, target 7.25
If all goes well, and in tonight's overnight session, NG behaves like it did in yesterday night's overnight session, then I may hold NG for another swing trade attempt. Yes, it swings around randomly and madly at times, but right now, it is behaving as expected, and that is what matters.
I've mentioned before that I am bullish on Natty Gas. I have been studying it for a few weeks now, and had made a previous swing trade on it (or at least attempted one).
So long as it behaves in an orderly fashion and according to my expectations, then I will continue to trade it. And the immediate plan is to hold it for as long as possible.
UPDATE: I am out of QGX7 @7.23. It stalled @7.245 previously, and so when it couldn't blast right through that level, I decided to exit, no questions asked.
Yeah, it's hard to hold a futures position, let alone a Natty Gas futures position, for any decent length of time.
LOL, now as I type this, Natty gas decides to blast off to new intraday highs. But that is ok since I am following my new rule - everything starts out as a scalp, and I only hold longer if the market proves me correct. I'm not interested in the market proving me wrong before proving me correct (which is what Natty Gas did here), risk control dictates that the market prove me correct first.I will look to see if there is another trading opp.
Anywyas, here is the chart recording my trade for posterity:
Tuesday, September 18, 2007
Update on my Natty Gas swing trade
Summary
Read Full Post.....
well, I woke up today to find out that I got stopped out on my Natural Gas futures position. I left my stop at 6.54, and that is where I got stopped out. Blecchhh.
I'm looking at the chart of NGV7, and it looks like the drop overnight went from 6.7 down to 6.2, which makes that drop more profitable than the long trade. But there was no way of knowing ahead of time that 6.7 would be a resistance level, because it just wasn't in the charts - not on the daily, not on the hourly.
So, while I'm not happy with the points that I left on the table, I have to accept the fact that I made the right decision to leave my stop @6.54.
Overall, if I had the opportunity to make this trade again, I would do so, so that means that I did make the right trading decisions. It was the market that decided to give me what it gave me, it is what it is.
Well, as I type this, Natty gas has jumped from 6.35 up to 6.6 in a span of 5 minutes. Looks like some crude oil shorts got real scared, and the short covering in crude is dragging Natty gas up with it. I will take another look at Natty gas tonight.
Monday, September 17, 2007
How I am Swing Trading Futures
Natural Gas is my vehicle for taking a stab at swing trading futures.
Read Full Post.....
I had been monitoring Natural Gas (NGV7) for much of last week, and when it busted out of its mini-resistance level @6.4 earlier this morning, I entered a long position on a pullback.
I went long QGV7 @6.465, and got stopped out @6.43.
So, after that I got a bit frustrated. I stepped back to take a look at what I was doing wrong. I took a look at the chart from different time frames (daily, 60min., 15min.). I think what happened was that I had the right idea to buy on a pullback, but I was using too tight a stop. Natural gas swings around wilder than a gorilla in heat.
I knew Natural Gas was going to make a move sooner or later, so I devised a plan to best prepare for that move.
First I did some research to prepare for the big trade.
Planning and Preparation
I went to the seasonalCharts website to confirm that indeed, Natural Gas is bullish during the months of September. In fact, both Natty Gas and Crude are bullish for all of September.
Then I went to check the daily chart of the Crude Oil to Natty Gas ratio. This ratio just touched the high end of its 1 year range yesterday, so there would be a bias for a reversion back down to the average ratio at around 10.
Then I went back to the daily chart to ascertain support and resistance levels. I noticed that the 50d EMA was sitting at around 6.40, but NG never made it down to that level today !
Another thing that I noticed on the daily chart was the Mirror Image Formation.
So the daily chart was looking encouraging. But what about the hourly chart?
The hourly was looking pretty sweet as well. One thing that I noticed was a double bottom @6.28 that was put in near the end of last week. That just reinforces the uptrend.
So, it is easy to see that there were actually a lot of things working in favour of an run-up in natural gas. The time of year, the daily, and the hourly were all lined up for a run-up. It broke above the 50d EMA, and had a Mirror Image Formation to back it up. I took a second look at the Natty Gas volume chart and noticed a box play formation setting up.
This was starting to look like real sweet, juicy, and compelling low hanging fruit to me. The only question was to plan out how much I was willing to risk in order to let the trade work out.
Trade Psychology
There is a bit of a mind game at work here (inside my head, that is). I have always dreamed about swing trading futures, but never had the courage to do so. Probably I was scared off by the high leverage - a couple of 10pt stop outs and your account will be hurting. And it has been a while since I have swing traded anything, let alone a futures contract. Am I scared? You bet. So that is why I had to do all this research to overcome my own fears. I had to convince myself that this is a good risk-reward scenario, and worth the risk of the wider stops that I would have to employ for swing trading. I tried to imagine getting stopped out on a 10pt stop and tried to imagine how I would feel about that loss. I had to become comfortable with the idea of losing that much money.
Trading Plan
So once I convinced myself of the opportunity, it was just a matter of waiting for a setup. The setup came with a box play pattern that was shaping up. In retrospect, it wasn't really a true box play pattern (since there wasn't at least two distinct rejections the same defined resistance level). But there was also a descending triangle pattern, which kept testing the 6.42 level. Each time, it would find buyers who pushed it back up. I then realized that I could use that level as my stop loss point. Now it was just waiting for an impulse push up. As luck would have it, my impulse push up occurred 5 or 10 min. after I had identified the 6.42 stop loss point. Everything was set, so when I saw the whoosh up, I went to market with a long position. I got a bad fill @6.47, but I did not care, since I was planning to hold this position overnite.
So, I am currently long QGV7, entry @6.47, initial stop @6.42, target = 7.0. I have since raised that stop to 6.54
Wednesday, September 12, 2007
Trade Review: ES
Summary
Read Full Post.....
Markets are slow, so I thought I would review one of the more interesting trades that I made yesterday.
Details of the trade execution are documented here.
1. Why did I take this trade?
ES gapped up, and had two opportunities to fill the gap, but instead, buyers came out of nowhere to lend support at the 1461 level. I interpret unfilled gaps as a sign of strength.
During the lunch hour dead zone, markets came down to re-test 1461, and when the sellers couldn't break below that level, then that was a sign of a possible reversal. What confirmed it for me was the pullback that reversed at around 1030a - this was a higher low. I got long @1466.5 at around 1033a.
2. What was the initial stop?
Right around the pullback reversal area, @1463. If the reversal failed, I should see it just before it dropped down to this level.
3. Why did you exit where you did?
In my homework, I had previously identified 1467-1471 as a resistance zone. When momentum stalled out just above 1472, I decided it was time book my profits.
4. Is there anything you would do differently?
Instead of waiting for it to break above previous high point @1467, I should have gotten in as soon as the pullback reversed, between 1464-1465. That would have minimized my amount at risk.
Wednesday, February 14, 2007
Post Mortem: First Solar, Inc.
Gotta burn this one into the memory banks....
Read Full Post.....
I was too steamed to realize it at the time, but now in retrospect, the execution of the entry was poor, since there was no volume to support the move to break above 33.6. Once I was in the trade though, I screwed up the placement of the stop. If you had somehow bought FSLR @33.61 and it's now just after 2pm EST on Feb 13/07, where would you have placed your stop?
Knowing what I know now about how First Solar, Inc. (NASDAQ: FSLR) swings wildly, I think I should have set a more looser stop. It was real frustrating to have this happen to me twice in one day (the other one was ESRX). After that loss (at least psychologically it felt like one), I couldn't bring myself to buy the subsequently sweet, and orderly breakout above 33.6.
Nothing like a spanking like this to teach me what to do right for next time.....but I sure wish there was a less painful way....
Monday, February 12, 2007
Hansen Natural Corp.
I daytraded Hansen Natural Corp. (NASDAQ: HANS) today
Read Full Post.....
First trade of Hansen Natural Corp. (HANS) was a pullback setup with the bonus of a dummy bar. I was happy with how i nailed the entry. Execution of the exit was poor - I didn't work out a pre-determined price target in mind, and also lost my mental focus, and got scared out at the first sign of some big shares showing up at the ask. I even had a hunch that it was just part of the normal pullback. I got mad at myself for selling too soon and tried to scalp the pending break above 41. After that, I basically ignored for the rest of the day, even though it offered additional low-risk entries in the afternoon.
In retrospect, I should have opened two positions in HANS - one for daytrading, and the other position for an overnight swing, since HANS closed up near its HoD.
Thursday, February 08, 2007
First Solar, Inc.
Dear Trading Journal,
Please don't torment me with First Solar Inc. (NASDAQ: FSLR).
Read Full Post.....
I daytraded First Solar Inc. (NASDAQ: FSLR) today. The setup was valid, but there was not enough buy volume. Took my loss as soon as I realized that.
MasterCard Incorporated
Dear Trading Journal,
It felt remarkably good to know that I can daytrade US Equities.
Read Full Post.....
I daytraded MasterCard Incorporated (NYSE:MA) today. First two was pullback setup - volume came in to push it above the previous bar to confirm buy signal. I exited the second trade without hesitation because I saw the momentum dying out on the tape. In the third trade, where i bought @113.79. That was not a valid setup, as I did not buy above the high of the previous bar. I redeemed myself by waiting patiently for the fourth trade. Buy volume came in off the natural number @114. I bought @114.05, target was 114.50.
I could have squeezed way more profits by daytrading the options for MasterCard Incorporated (NYSE: MA). However, I didn't have the option symbol that I wanted pre-selected and all ready to go on my watchlist. Fortune favours the prepared, will remember that for next time.
Thursday, January 18, 2007
Daytrading Forsys Metals (FSY)
The charts never lie
Read Full Post.....
1. Why did I take this trade?
Because Forsys was breaking out of a mid-morning consolidation after huge volume buying in this morning's open.
2. What was the initial stop?
Iinitial stop was at 5.93. If the breakout failed, it would be pretty obvious.
3. Why did you exit where you did?
It first stalled for a bit after breaking above 6.10. After another surge, it stalled again near 6.20. I thought that was the end of the run when it stalled for the second time.
4. Is there anything you would do differently?
Forsys Metals (FSY on the TSX) got another surge of buying volume today. In retrospect, I should have been more focused and alert to that fact. I should have been more aggressive with the number of shares purchased, since there were plenty of buyers today to provide fuel for the run-up. It looks even better on the daily chart:
If there's any follow thru buying in the next couple of days, I will definitely jump back in, and probably hold longer.
There's Always a Bull Market Somewhere
Markets are selling off, but not this guy
Read Full Post.....
I did buy Fronteer Development Group (FRG), but not in my trading account, so I won't log it in the Trading Performance. The above chart actually shows a hammer reversal pattern, followed by a nice V-shaped recovery from the selloff at the beginning of this month. FRG is breaking above the significant resistance level set back in Nov/06. Plenty of buy volume is coming in, so this should last at least another day.
A couple select (Canadian) Uranium companies are doing well today - LAM.to, FSY.to, both receiving plenty of buy volume.
Friday, January 05, 2007
MAMA turned cold
MAMA ain't so hot.
Read Full Post.....
My trade in MAMA is considered a victory even though I lost money on it because I traded according to my plan. My original stop loss was near the opening low @5.6. When I saw that it made an intraday low at around 5.63, I moved the stop up to 5.64. I honoured my stop loss @5.64. Keep your losses small. Be glad to take losses when it is according to your trading plan.
Morning Update: So Far So Good.....
Friday Morning is working out well so far.
Read Full Post.....
Sold GSOL into strength
With GSOL, I saw 99 appear on the ask so I sold half of my holdings. Then I sold the rest when it managed to break above 19. As it turns out, I should have held on to the remainder of my holdings, as GSOL is up to 19.40 as I type this. Oh well, maybe my fingers won't be so itchy next time.
Picked up some MAMA (5.8), and ONSM (2.8)
Looking at buying some FRG on the dip.
I'm actually too busy to look at ER2 today, maybe that is a sign.....
Nothing helps the psyche recover like a boost in account equity......
UPDATE: ICE sure looks very tempting right now, but I am not in any position to buy calls only to turn it into a daytrade. Will be waiting for a pullback. If ICE really is at the start of a serious uptrend, the pullback is the lower risk play, NOT on the 3rd consecutive up day (though the chart looks very strong right now).
Wednesday, January 03, 2007
GHDX
Took a shot at a low volume, smallcap biotech stock.
Read Full Post.....
1. Why did I take this trade?
Because the stock was showing all the signs of a classic breakout pattern. Volume was there (at least for this stock, 400K shares traded is considered high volume).
2. What was the initial stop?
1% below my entry point.
3. Why did you exit where you did?
I got scared out of my position. Watching the profits shrink instead of letting the trade work itself out played in my head.
4. Is there anything you would do differently?
I think watching the ticker drop from 19.85 to 19.45 made it hard for me to feel confident about my trade. Had I not been actually watching the chart of GHDX during that 0.40 pt plunge just before 12p EST, I would have probably stayed in the trade.
Note to self: This is a good example of the need for a plan to sell half of your position, and keep the remaining half. The first half of my position should have the tighter stop (19.75), and the remaining half of my position should have a looser stop (@19.24, or breakeven).
Wednesday, December 13, 2006
The Power of MicroCap Wednesdays
Got back into some Microcaps today.
First one was Altius Minerals (ALS.v): In this case, ALS is not a disease, but a junior uranium explorer that is turning itself into a merchant banker for other junior explorers. Paul Van Eden, a newsletter writer and portfolio manager, is head over heels in love with this stock. He claims that this is one of those stocks that you can buy and hold forever.
Riiiiiiiight..... If he loves it so much, he should be glad to buy it from me for .... $18? I mean, after all, if you are comfortable to hold it forever, it just might hit $18 one day. Unfortunately, today is not that day.
I bought Altius Minerals (ALS) when I saw the bullish flag on the daily chart, and volume was picking up and setting up to break to new highs. I plan to hold this for a swing, market conditions permitting.
Next one was Energy Metals (EMU on the NYSE, EMC on the TSX): Volume was also decent looking, so I jumped in @9.16. My thesis is a play of the pullback pattern. If it doesn't break back above the 20d EMA, I will probably bail.
And last but not least, there is HudBay Minerals (HBM):
I bought my first position in HBM on the break above 22. 22 is one of those round numbers and stocks tend to have an affinity for round numbers (ie. resistance/support tends to be at a round number, as opposed to something like 22.37 being a support level). The next position was on the break above 22.5, another pseudo-round number.
HBM looks to me like it is on the verge of completing a U-Turn reversal pattern. Volume will be the deciding factor, but so far so good.
Monday, December 11, 2006
Just Another Magnanimous Monday
 "When you ain't got no money, you gotta get an attitude."
-Richard Pryor (1940-2005).
I woke up late, after market opened, but as soon as I got to my senses, I got busy immediately and made many trades today. I will post charts of the interesting ones. First up is NRPH: NRPH was one of two HCPG newsletter picks that I traded today. NRPH showed all the signs of a U-Turn reversal pattern. However, there was no sustained volume to push it above the resistance @58, hence the failure and drop back down. It would have been a good daytrade nonetheless if one was alert enough to get in on the break above 56.50 - good for at least a buck scalp.
Next up is Vonage: I found VG from some Yahoo! Finance blurb about the growth of VoIP . The daily chart looked good, so I decided to enter a position when it broke above 7.17. There was an attempt to flush out some stops in the afternoon session, but there was no volume selling behind that move, so I stayed in. Unfortunately, today's gap up never filled, so I will need to tighten my stops. For tomorrow, I am looking for VG to stay above 7.25 on some decent volume (something like what we saw today would be nice), otherwise I will consider selling.
Next trade was GROW: I've traded in and out of GROW as it ran its way up to a double in the past two months. I'm not even sure how long GROW will allow me to stay in it, my stop is still at 59.75, and even that is up for debate.
Not long after this, I bought some RIMM Puts @5.2. I will post a chart as soon as I close out my puts position.
My last trade for today was Ctrip: Ctrip.com was another HCPG newsletter pick. It kept going up and up, so I decided to keep it for a swing trade.
At this point, the following happened to me: I ran out of capital to buy additional positions !! So, I missed out on these great buys:
 Unlike NRPH, the U-Turn Reversal in OMTR succeeded because there was volume to push past resistance @13.61. It did get a bit choppy in the last half hour of the afternoon session, but it still managed to close less than half of an ATR away from the HoD.
The other one that was in my scans was BRLC: It was hard to watch BRLC leave the station without me.......
Wednesday, December 06, 2006
Wednesday's Results
 Despite getting smacked around by BIDU yesterday, I jumped back in today. I mentioned before that I planned not to buy calls within the first 15min. of market open. So then why did I break away from that plan? Because the bid/ask on the options were not jumping around and misbehaving like how I have seen so many times. The setup looked decent - it broke above yesterday's HoD and the resistance level @122, and the 10 candle EMA was intact. So, I decided to take another crack at it.
So why did I not heed the warning when the 10candle EMA was violated? This is where the mind games began. I was becoming wary of my tendency to overtrade too much lately, so I was looking for ways to rationalize the desire to continue to hold onto this one. BIDU still looks strong on the daily chart, and I am beginning to get a good feel of how it behaves, so we'll just have to see how it goes. I bought UARM based on the HighChartPatterns (HCP) newsletter. I was a little late to the party, but saw that the stock was not showing signs of failing the breakout. So I decided to go for it. Volume picked up and was sustained for the whole time after the breakout.
I also bought NTRI@73.75 for my wife's retirement account based on the HCP newsletter recommendation.
Overall, I felt that I did well today, not overtrading, and starting to become (just a little) more patient with the setups. Including today, I've had a mini-streak of 3 consecutive days of profits (see the performance webpage at the right sidebar). Monday's gains were attributed to Wi-Lan, as were much of Tuesday's gains. Today's gains are attributed to BIDU calls. I probably would have done even better if I didn't indulge in some (failed) scalps of SU on the TSX. Realistically speaking, I do expect this win streak to come to an end very soon, but at the same time, I feel more motivated now to prove that this is not a fluke.
Tuesday, December 05, 2006
Deconstructing my GROW trade
Here is how my GROW trade turned out:
As pointed out by SimplyOptions, I bought GROW before the break of the OR high, which I admit was higher risk (because it could and often does, just reverse at the level of the OR high). The reason that I did that was because I noticed that the volume started to pick up, and the bid was starting to move up as well. Compare this with a lower risk entry (copied from the Dec 04/06 edition of the HighChartPattern newsletter, with their permission of course): My purchase was one of those candlesticks before the break above the yellow line (@51.31). Yes, it would have been lower risk to wait for the break above 51.5, and yes, it would have been better to be just a little bit more patient, but I'm not going to beat myself up over that.
I will say, though that I clearly did not have an exit strategy with GROW, and I'd much rather beat myself up over this instead - LOL!
I sold today @57.53 but again, I had the bad habit of watching just the ticker instead of trading the chart. Had I been watching the chart instead , and pasting up a moving avg line (2 clicks of the mouse on the IB TWS), I could have easily and realistically extracted another $1.40 from this trade (the MA would indicate a sell just below $59). An extra $1.40 of profit was left on the table - that sucks !!
Trade the Chart and not the Ticker !!
Wi-Lan update
I posted about my Wi-Lan trade yesterday. Here is how it turned out (1d/5min chart):
Although exiting and then re-entering back into the same stock in the same day could be considered a screwup, I did feel that this one was tough to hold onto as the morning session wore on. As usual, volume dried up as the morning wore on.
What I did go back to doing was trading the chart. Because I have been watching the ticker more and more, I started "forgetting" to do that in the past few days, and now that I'm back into doing it (looking at my position from a 5/15min. chart), boy does it make a difference ! Right away, I could see where I should exit my new position in WIN, and where a possible re-entry would be.
Lesson of the day:
Trade the chart, not the profit.
Trade the chart, not the ticker.
Monday, November 27, 2006
Today's trades
AAPL gapped up and started running out of the gates pretty strong this morning. I thought to myself, What a way to start your morning! Little did naive ol' moi know what carnage lay ahead. Blech... Despite being chopped out of AAPL, I wasn't ready to give up yet (even though at this point, I knew I had to get out of all of my calls that I held from last week). Aren't I a sucker for punishment? I noticed that GROW was moving up strong despite the market selloff.
 Now, I know that GROW is a wild swinging stock, so I was hesitant to enter a position only to be chopped out later. So what I tried was this:
During that narrow range candle, when the price action was slow enough, I started my bid at the BestBid+1 (bestBid was at 49.13 at the time). The BestAsk at that time was about +0.40 away, which sounds like a wide spread, but typical of GROW. Of course, there's always some computerized trading automaton that matches the bestBid. (Not sure why these programmed trading computers do that, but I see that happen quite often.) So I kept bumping up my Bid by 1 until no one wanted to match me. Then I just let it sit there. Within a few minutes, I was filled !!
For stocks with wide ranging spreads, I think I will continue to try this technique.
Also, note that these particular charts were generated by using traderZBS's handy dandy chart generating tool. If you have an IB account, give it a test drive!
Saturday, November 25, 2006
Closed grow
As previously mentioned, I place a trade in grow. Here's how it turned out: Without knowing what happens on Wednesday, the only technical reason that I see for holding onto that trade was because it did not violate the 10d EMA. However, GROW did not break above any intraday resistance, so that was one not so encouraging sign. I'm glad I sold where I did.
But now that GROW has started pulling back, there is a possible play on the pullback pattern here, so I will be watching it in the coming week for a possible low-risk entry point.
Thursday, November 23, 2006
daytrading RIMM (on the TSX)
RIMM trades as the ticker RIM on the TSX.
I wasn't surprised by the bullish tone on RIM, but I was surprised by the strength of the buyers, esp. given the light volume in the morning session.
As it turns out, there was no technical reason to sell @159.27, other than fear of losing my profits. In retrospect, the 7th candle (10am), which started just above that level, was actually a good time to buy. I was whining to myself about how I didn't take on a big enough position size, and of course, it never dawned on me that the ticker was offering me just that opportunity to increase my position size.
I guess I've been so conditioned to protect my profits, and sell into strength that I forgot to look for opps. to increase my position.
But, even though there is still much for me to learn about when to take profits, I am still happy with my profits that I did make with these two daytrades.
Tuesday, November 21, 2006
Deconstructing My BIDU call option trade
As mentioned yesterday, I closed my BIDU options trade after holding it through the weekend. SimplyOptions Trader (who's got a nice options blog of his own btw, check it out!) asked about my BIDU trade, so I thought I would explain my thought process before, and during the trade.
1) Why would you be paying attention to this stock on Friday Nov 17, 2006?
Because it had gapped up the previous day.
2) Is the trend up or down? Would you be looking to get long or short this stock?
Trend is up. Would be looking to get long on BIDU calls.
3) Where would you get long/short this stock on Friday Nov 17, 2006?
The lowest risk entry would be on a break above previous day's high with accompanying volume. However, I got long when the price/action indicated to me that BIDU was not going to fill thursday's gap (at least not on Friday). So there are now two reasons to go long:
- it was challenging previous day's HoD
- price action indicated a good probability of previous day's gap up not being filled.
4) Where would you put the initial protective stop?
106.95. What that meant was that I would sell the calls and close my position if BIDU dropped below 106.95
5) Why did you hold over the weekend?
Because there was a good bullish tone to the price action.
Because it closed near its HoD.
Because the previous day's gap up did not fill.
Because the setup was there to provide a good chance of follow thru buying in the next trading session (Monday).
6) Where would you exit the position?
BIDU is making new ATH's, so there are no pre-defined exit points above current stock levels.
The reason I sold my calls @111 was because that is where the stock started to reverse, indicating that there would be a lack of buyers to push it beyond 111.
As it turns out, I closed my BIDU trade too early. And guess what? BIDU is one of those stocks that I thirst for. Why? Because it is doing now what AKAM and STEC did in Sept, and what AAPL did in Nov/05.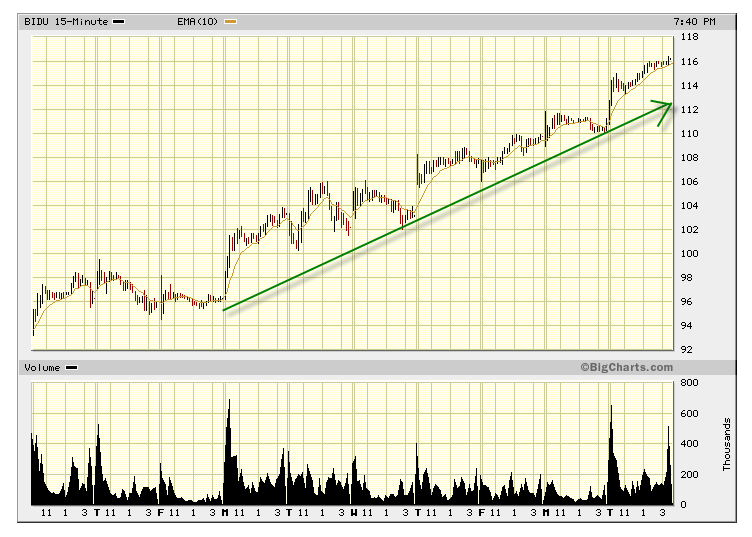
With my current methodology, it really is hard to hold onto a stock like BIDU for the whole month. I haven't been able to do that without taking on some extra risk. When a stock like BIDU goes on a run for 1 or more months, it seems the only way to stay on the ride for the whole time is to keep your stops loose. But the longer you are on the ride, the more you expect the ride to end !! Anyways, I'm still trying to figure out how to make the most of these multi-month momo runs when they happen. If anyone has it figured out, let me know.
Monday, November 20, 2006
Closed my FRG swing
I mentioned that I bought FRG (on the TSX) last wednesday. Here is how the trade turned out: Boy does that feel good...
The great news is that FRG is not done yet. Not by a long shot. Will be look for another pullback to jump back in. Gold and Uranium (metal price) are just getting started. If it stays near 11 (on the TSX), that is a bullish sign.
Wednesday, November 15, 2006
Same Old Same Old

Let's see, which of my trading rules did I break today? Ah yes, it was Rule #4, which says to put in the time and patience to select only stocks with well-behaved, good quality, high probability, low risk setups. AAPL on last Friday's pullback was considered a low risk setup. But today? Questionable at best.
What was going thru my head was whether I should cut my losses or make this a swing. During Options Expiration week, how did a thought like that get into my head? I'm at a loss to explain this sort of screwup. And since I'm finding myself repeating this mistake again, I think it just got that more important for me to work on patience. I've also noticed lately that I haven't been as patient with my daughter as well...... any correlation here? Does it need to get any more obvious that I need to work on patience?
This screwup stayed inside my head most of the day, such that I didn't really feel the victory from buying back into Fronteer @ 8.57 (FRG closed today @9.1 on the TSX). It's true what they say - the pain from a losing trade far exceeds the feeling of victory from a winning trade.
It may sound like I'm overly hard on myself for making this mistake, but I guess that is the approach I'm leaning towards for coaching myself. Take my lumps when I lose, and celebrate when I win.
Chin up, move on..........
Tuesday, November 14, 2006
BreakWater Resources, Round 2
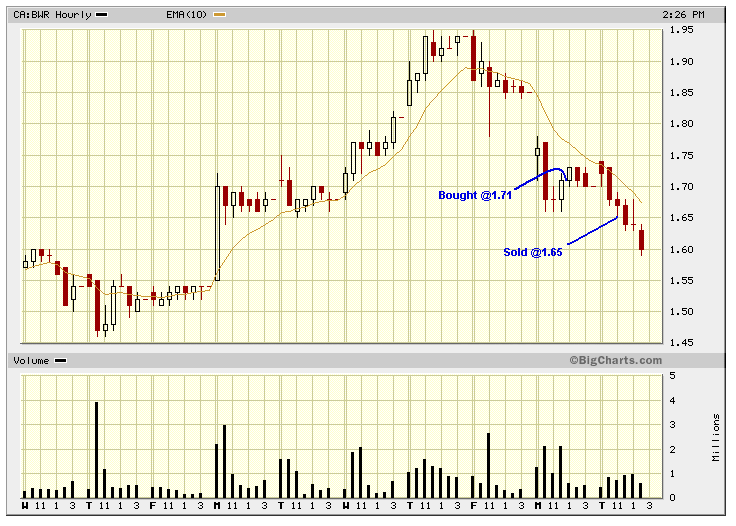 The first time I tried to trade BreakWater Resources, I was successful. However, this time, I tried playing the dead cat bounce in BreakWater Resources (BWR). That idea in itself was not a mistake. However, this was a screw up in two aspects:
1. I knew the short term trend was down, but even so, when it offered me the chance to get out early this morning, I did not take it.
2. I had a wider stop, but still did not reduce my position size. So, I deserve the stop loss that I wound up taking.
Monday, November 13, 2006
Closed out my ROK swing trade
 Roca Mines closed today @1.58, so it seems like I may have left a few points on the table. Will be monitoring the $1.47-1.48 area for any signs of buying support.
Friday, November 10, 2006
MicroCap swing trades
I mentioned previously at MCM's blog that I would make a post on a trade that I made based on one of his recommendations. . My apologies for the delay, but here it is. First one is BreakWater Resources (TSXV:BWR): I no longer have a position in Breakwater, but I am currently monitoring BWR to see how it behaves between 1.85 and 1.90.
Next trade is Roca Mines (TSXV: ROK), and the idea for this also came from MCM's blog: I heard about ROK before, but didn't really understand their story until now. As with all microcaps, volatility is the norm, and these guys can swing more wildly than anything else I know. Although I agree that this one has some room to run, I will be watching the price and volume the key levels: 1.44, and 1.26. Even though I mentioned that my initial stop is at 1.44, if it does ever drop down to that level, it will still be a case by case basis as to whether I dump. I will be monitoring the price and volume behaviour very closely for sure should that happen.
Tuesday, November 07, 2006
Closed My RIMM options trade
 Left a bit of money on the table with my RIMM calls. Based on how RIMM pulled back to the 10 candle EMA line and bounced right off it, I would actually classify this trade as a mistake if I didn't make so much profit from this trade.
The daily chart still looks good, and definitely got the volume today, so I will check in tomorrow to see if there is another opportunity to get back in.
 NetVibes Me!
 BlogLine This!


