I recently finished listening to the Dave Landry webcast (Oct11, on trading psycology) for a second time . What he had to say resonates with a couple of the problems that I've been having with my trading. There is some good advice there which could almost be considered trading rules.
1. Obsess before you enter the trade, NOT after!
Whether you're a day trader or a swing trader, this rule rings so true - after you've entered a position, there's really only two things that you can actually do: sell, or watch. If you sell early (ie. actively close your position before your stop hits), then that means you're either NOT proven right (debatable, but I will elaborate in another post), or you're not honouring your stop loss. He encourages entering alerts - alerts for when the stock is close to your profit target, or even close to your stop. Once you have your alerts and your stops in place, and the market hasn't yet given you a reason to sell, then all you can do is watch, and at that point, then you need to ask yourself whether that is the best use of your time.
However, before you enter a trade, there are many things to check, including:
- confirm market trend,
- confirm sector trend,
- confirm stock trend,
- confirm acceleration and/or persistency of trend,
- confirm stock trades cleanly,
- double/triple check that your initial stop is correct.
2. Trade management: Active vs. Micro.
micro-management (bad) - making too many decisions, exiting too early, not letting the market decide when to take out your stops. The rationale here being that micro-management increases the probability of missing out on the big trending up runs.
Active management (good) - putting in limit orders when the price is close to profit target.
3. The method for digging out of a hole is simple (at least according to Landry):
Trade smaller position sizes.
Honour your stops.
4. 80/20 rule: 80% of your profit comes from 20% of your trades.
Followers
Tuesday, October 31, 2006
Better Ingredients == Better Pizza.
Posted by
Phileo
at
10:56 PM PermaLink This!
0
comments
![]()
![]()
Labels: rules
The Power of Greed
There is famous and gripping scene in The Exorcist where Father Karras is attempting to drive out the demon that has taken control of Megan. He is in the bedroom with her, takes the cross and begins chanting "The power of Christ compels you!" repeatedly.
Well, I have a personal demon as well, and his name is called Greed. Today, I had an intense battle with Greed and lost. Here is how it unfolded: I mentioned yesterday that I would be looking to get out of my BIDU calls near today's HoD. Well, I did manage to get out near today's High - which occured when BIDU opened with a nice gap up. This morning's action was so fast paced that BIDU managed to fill the opening gap within a few minutes. Then, it looked like it was going to reverse back up and challenge the HoD. At least, that was what I wanted it to look like. It would be another couple of bucks to move back up to the highs, and that would mean a nice and juicy pop in the calls. So I got greedy and bought back into some of those same Dec 90 calls, but without waiting for any confirmation of the trend reversal. By trend reversal confirmation, I mean another green candlestick, and some volume to accompany the reversal. The volume did actually show up - but only for the selloff!
I've actually been getting better at following my rules lately:
1. honour my stops
2. keep my losses small.
3. Select well behaved stocks with clean looking charts and decent setups
4. Keep my position sizes smaller for stocks where I needed to take wider stops.
But in jumping back into the call options that I had sold just minutes earlier, I made two serious mistakes:
1. Entered a trade because I succumbed to the demon of Greed. The thought of making more money on these same calls clouded my judgement.
2. Did not wait for the the chart to tell me it was reversing the initial downtrend, instead I anticipated, and in the end, hoped for a trend reversal.
As it turns out, the selling became vicious after 10AM, so I was actually lucky to lose just the majority of the additional profits made from this morning's gap up.
Hindsight is 20/20, but it looks like the better move was to buy puts instead of calls, as indicated by this chart of BIDU Dec 90 Puts: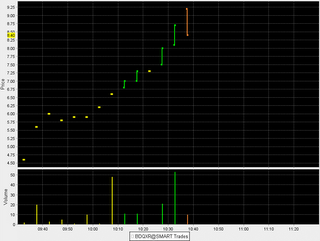
Never underestimate the power of Greed - all it took was a couple of minutes for Greed to work its power to cloud my judgement. I'm not sure if I can ever exorcise this demon of Greed out of me completely, so it is in my best interest to actively seek to further understand this destructive side of me, and study how it manifests itself in various subtle ways. I don't forsee any proactive, feel-good, quick fix, "looks good on paper" plan for dealing with the problem of greed. It's going to be more like a grind it out, slow and steady path to a higher degree of self-awareness in order to overcome greed.
Posted by
Phileo
at
10:41 PM PermaLink This!
0
comments
![]()
![]()
Monday, October 30, 2006
grow
Made one other trade today: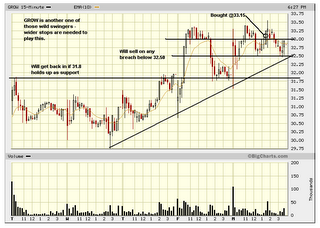
GROW is another example of where taking a smaller position size enables me to take wider stops, and thereby keeps me in the game.
Posted by
Phileo
at
11:40 PM PermaLink This!
0
comments
![]()
![]()
Labels: trades
What market pullback?
As implied by my previous post, I was looking for a market pullback this week.
Okay, ok, I know I'm not supposed to anticipate, nor predict where the market is headed, but if this is the extent of the market pullback, then I think we could see a serious rally to the end of the year.
Just some thoughts on my watchlist from the weekend:
TGT - market proved me wrong, looks like a long candidate instead of a short now.
AVCT - peeked its head above 37 this morning, but that was just to take out the buystops. Now we wait for the volume to come and a second attempt at breaking above 37.
NVEC - never had a chance to buy below 41, broke above 44 in a big way. Not sure I would play this right now, but will be waiting for the next pullback.
STEM - Hmmm..... if STEM went up because of Rush Limbaugh then it might not be so bad (for me) to see him shoot off his mouth again.
Gold stocks - quietly inching its way up - did anyone else notice the bullish action in the charts today ?
I also made a trade on BIDU options (BDQLS == Dec 95 calls). It was a very small position, because of my wide stop, plus I'm familiar with BIDU's wild swings in the past, plus I am already heavy into STEM. Anyways, here's how it unfolded this morning.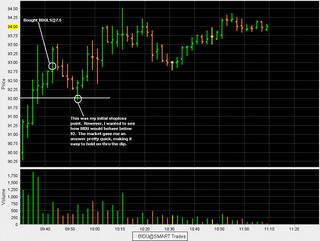 BIDU reports on Nov1/06 BMO. I think they will beat estimates, but old lessons from holding thru earnings are still etched into my psyche. Maybe I will look for tomorrow's HoD to close my options play.
Posted by
Phileo
at
8:57 AM PermaLink This!
0
comments
![]()
![]()
Saturday, October 28, 2006
All that Glitters
Here is something worth watching in the next week or so. The gold sector is starting to show signs of life once again. Many of the gold stocks have been building base patterns in the past month or two. Here is my analysis of the chart on gold: Though there were exceptions last year, in general, Gold move inversely to the movements of USD$, so any weakness in the USD$ will add fuel to a possible gold rally.
Posted by
Phileo
at
10:06 PM PermaLink This!
0
comments
![]()
![]()
Interesting Charts for Next Week
As promised, here is a chart on STEM which explains my purchase decision in more detail: STEM also has increasing OBV. Many technical indicators are in agreement with this stock, not to mention the nice volume spike today. Plus the 15-minute chart has given me a low risk stoploss at around 2.87.
I ran my custom, cooked up MSN moneycentral scan of stocks near their 52-wk highs. Most of them looked like they were in the process of rolling over. However, a couple of them looked interesting. First one is TGT, which looks like a short candidate, esp. if there is a market wide pullback next week: The next one is AVCT (long candidate):
 Last one is NVEC (very short term candidate):
Posted by
Phileo
at
12:22 AM PermaLink This!
0
comments
![]()
![]()
Friday, October 27, 2006
Not All Pain is Gain
Well this morning, I started scalping my old favourite RIM. I made 5 scalps, and wound up down in the hole $50. My thought at that time was, all that hard work went down the drain, what a waste.
Then to try and take my mind off of things, I went surfing for some finance websites (like the new Flock browser, new FF extensions, etc). While I was surfing, it occurred to me that I haven't checked my papertrading account for quite some time now. In fact, I haven't made a trade there since Sep12/06. So I go over to login to my VSE account and was curious to see what shape my portfolio was in. Crikey, it performed better than I have in the past 6 weeks !!?! This was an portfolio that was "margined" (ie. portfolio size was greater than cash available), and was left unattended for 6 whole weeks, no trades, nothing, and it still outperformed me (if you're interested, check out the "DayTraders" game in VSE, I am under phileo, ranked about 264 as of today). Boy, I hope that was a fluke, random, coincidence, because if it was NOT, then I would feel a bit discouraged. In any case, I am going to continue that experiment (pick something trendy, leave it for about 4-6 weeks, and come back to VSE and see how it does).
Then to top it all off, I had distractions at work again today, and when I came back to my desk, I found that GOOG had just tanked by about 8pts!
So why didn't I just place a Goog put buy stop order, you say? Because:
a. shorting is not my strength
b. I'm still new to daytrading options.
c. I feel even less comfortable make a short trade and not being around to watch it.
Anyways, that's how my (trading) day went today - some days you are the boxer, and some days you are the punching bag.
(UPDATE) Bought STEM @2.9about 5-10 min. before close, will post a chart later on tonite....
Posted by
Phileo
at
12:03 PM PermaLink This!
0
comments
![]()
![]()
Thursday, October 26, 2006
All that Money on the Table
Various distractions at home and at work left me with time for only 1 trade today.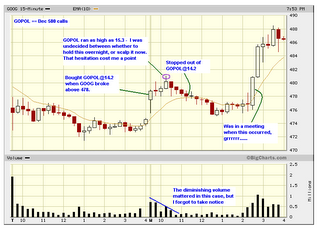 Obviously I left a big point on the table, but the key question here is if I had to re-do this trade all over again, would I do it any differently, not knowing that it was going to slide all the way to the FOMC meeting ?
Probably yes, because if I were to re-do the trade all over again, I would notice the declining volume, meaning there were not enough buyers to continue the push it beyond 480, ie, there were more signs showing up to indicate an increased risk in this trade. That meant going for the quick scalp once it failed to hold 480, instead of holding out longer for more gains.
Also, I'm not too sure how many more of these $10 days that Goog has left in its bag of tricks. Without these big $10 moves, I'm not sure I would want to risk another options trade. We'll see how things unfold in the next few days.
Posted by
Phileo
at
12:11 AM PermaLink This!
0
comments
![]()
![]()
Wednesday, October 25, 2006
Thoughts on options swing/day trading
You know, yesterday I was searching half-heartedly on the 'Net to see if there is anyone else doing what I have been trying lately - daytrading and swing trading options. Sure, there's Adam's options trading blog, but he focuses more on educating newbies like me on options trading in general (which I am starting to read, by the way). I think that the folks at DayTrade Team (DTT) do get involved in options swing trades, but they only report it after the fact. I suppose that is not that much different from what I have been blogging about here, but I want to provide a different focus and perspective on it.
I haven't been able to find too many websites that talks about doing options swing trading, and certainly none on options daytrading. And also, I haven't found, anyone blogging about their own options swing/day trading experiences. So, I will be the one of the first guys to do it - although at this point in time, I don't really see myself getting heavily involved in too many options daytrades (esp. once the euphoria over my Goog call options win dies down). But I will talk about my options trades whenever I do make them, and hopefully I can get to the point where I will talk about the ones that I will focus on ahead of time. Sort of like how I talked about my Goog call options trade ahead of time (instead of after the fact).
In regards to the suggestion to buy AAPL calls last week, IMO, the options swing trade that they (DTT guys) and Brian Shannon suggested was a higher risk options trade than my GOOG options daytrade. I'm glad that it worked out for the DTT guys and Brian, but holding AAPL calls thru earnings is not something that would fit my risk tolerance.
By the way, here is how my RIMM call option trade turned out:
Posted by
Phileo
at
9:45 AM PermaLink This!
3
comments
![]()
![]()
Labels: options
Tuesday, October 24, 2006
My thoughts about HighChartPatterns
After reading Richard's udpate review of the HighChartPatterns service, I thought I would add my own two bits about it.
I used to complain about not being able to find quality, well behaved, tradeable setups. But now, I have the opposite problem - too many stock ideas, and not enough time to filter through them all!
On a typical night, I usually start with Alan Farley's 7-Bells to get some ideas for possible pullback or dummy setups. Then I go to Richard's website to look at the list of 30d Highs (I ignore the 30d Lows list mostly because I have a natural affinity to take the long side of a trade). Then I run my own custom, cooked-up MSN scan of stocks near their 52-wk highs. Then I watch Brian Shannon's nightly video for additional stock ideas. Then I check out Russ's website for stocks that look like they may be offering a "second chance". I also review some of my previous trades for ones that look like they have potential to setup again. And for the past week or so, I've also been reading the HighChartPatterns newsletter (I'm still on the free trial).
With the exception of the HighChartPatterns newsletter, I find that I have to spend a good hour or so to filter out all those ideas for the best candidates. By filtering I mean looking at the chart and deciding which ones have a tradeable setup, then working out support/resistance areas. Then actually working out a buy alert price range.
The HighChartPatterns newsletter currently costs $30/month. There are about 21-22 trading days per month, so that cost breaks down to about $1.4/day. In other words, that time that I spend searching, scanning and filtering all of my idea sources is valued at $1.4/day, and I still don't consistently come up with the quality ideas that I find on the highChartPatterns newsletter.
$1.40 cannot buy you a Starbucks coffee.
$1.40 cannot buy you a BigMac
$1.40 cannot buy you the weekend edition of your local newspaper.
But for a mere $1.40/day, I can get some consistently good quality trade ideas from the newsletter. The key here is consistently good quality. Not a bad trade at all in my mind.
Note: I do not work for HighChartPatterns.com, nor am I affiliated with them in any way. Heck, they probably don't even know I exist.
Posted by
Phileo
at
11:17 PM PermaLink This!
0
comments
![]()
![]()
Labels: ProductReview
RIMM
Today there were important reasons for me to not trade. First off, I've gotten into the habit of entering my buy alerts into my trading acct. for the stocks that I'm interested in trading for the day. However, I was too tired to do that the night before, so I felt a bit unprepared. On top of the usual distractions at work, I also felt not quite mentally alert and focused for trading. If it weren't for my curiousity about how the Google calls were doing this morning, I probably wouldn't have woken up before market open.
So anyways, I just watched the usual suspects today (goog, akam, hans, ndaq, brcd, ise, etc.) not really intending to trade. Pretty soon, I saw something pop in one of the charts I was looking at. It was RIMM! My sentimental favorite for scalping on the TSX was actually having a decent volume break out! Since RIMM is one of the very few high profile, high volume dual listed stocks (listed RIMM on the NASDAQ and as RIM on the TSX), I naturally turned to the TSX ticker to see what was happening. Here's how my trade turned out: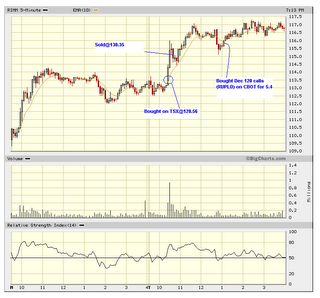
Yup, it was right after I made that profitable scalp on the TSX that the thought occurred to me to check out the calls. Chart had a nice pullback, but behaved "nice" and orderly in the sense that no significant support levels were breached. As it started to bounce back from the pullback (note the decent volume), I went ahead and bought some calls in the afternoon.
Posted by
Phileo
at
8:57 PM PermaLink This!
3
comments
![]()
![]()
Labels: trades
Monday, October 23, 2006
Snapshot of my Goog call option daytrade
Since I have so much time now that I am not going to trade for the rest of the day, I thought I should capture a chart of my Goog call option daytrade so that I can analyze it a bit more in the near future.
As reference, here is the chart of the underlying stock: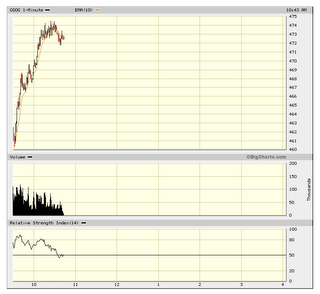
Here is the real-time chart of the option: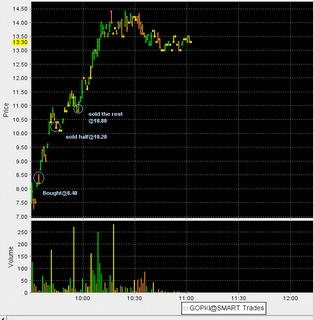 Note that the option chart mirrors the chart of the underlying stock, but the %moves are much more magnified in the options chart. But on a 1-minute chart, things happen real quick, and decisions have to be made just as quick.
Posted by
Phileo
at
8:19 AM PermaLink This!
2
comments
![]()
![]()
Google options, Part II
Call me masochistic, but I went back and daytraded some Google calls again. The first time I tried it I lost a big chunk of change. But this time the trade happens to go my way, and I made up for the previous loss in Google calls and then some.
What was very different this time was that there was a clear move to the upside in GOOG stock this morning. Because the options move was way bigger than the move of the underlying stock itself, I had to pull up 2 separate charts, one for the calls that I bought (Nov 480 @ $8.40), and one for GOOG stock. Starting from the opening bell, the stock went from $461 to $469, about a $8 move in the opening 25min. That's an unusually big move even for GOOG stock, so when something like that happens, buying call options will magnify that move.
It's pretty crazy, but one big win like this can make you feel emotional and even somewhat overconfident. As a result, I won't trade for the rest of the day (except may scalp some of the canadian stocks if I feel emotionally up to it).
I remember RMBS had a similar big move earlier this year, and I bought the stock at the time, but saw the call options jump up really big time.
But in general, looking for these kinds of big moves in a stock is even harder than looking for those dummy setups. If it weren't for my obsession with GOOG, I probably wouldn't have even known to stalk it for this opportunity.
Posted by
Phileo
at
6:53 AM PermaLink This!
0
comments
![]()
![]()
Labels: options
Saturday, October 21, 2006
Despite losing money over Google options, I still have this weird, borderline obssessive fascination over this stock. I don't know why. Google gapped up after yet another record quarter, closing @459.67 on Friday. So, to appease my GOOG obssession, I've compiled some statistics about goog's earnings related breakout gaps in the past 2 years.
#gap fills/#gaps: 5/7
time length before gap fill: 2wk, 6wk, 4d, 2d, 3d, 3m
#of unfilled breakout gaps: 2
context of breakout gaps:
1st one was during the traditional fall market run-up, but it was not part of any index.
2nd one was during a sideways mkt
3rd one was a true breakaway gap that never filled, happened during market up trend.
4th one occurred just before market topped, was filled during the traditionally slow summer doldrums
5th one was a breakaway gap (occurred during mkt uptrend) that was not partially filled until Mar/06, about 5 mo. later.
6th one was a gap down (not highlighted in the chart), filled on next Q report, occurred during sideways market.
7th one was filled during sideways mkt (and just before mkt correction).
And that leads us to our 8th gap yesterday (Fri. Oct. 19). The context? Market is in an overbought phase, but the trend is still up. The previous 2 October earnings gap ups led to a run of 2 wks and 10wks. Conclusion? Assuming that the market stays healthy (ie. no market correction), the ***BET*** here is that Goog goes on a run-up at least to its ATH @475. Probably at that point we will find out whether this is a gap that gets filled or is another true breakaway gap.
Posted by
Phileo
at
10:35 AM PermaLink This!
0
comments
![]()
![]()
Labels: options
Thursday, October 19, 2006
Ideas for Friday
BRKR - 8 is the magic number, but need to see volume to accompany it.
O&G is back in vogue......
ECA - NR bar, look for a break above Tuesday's Hi
CNQ - NR bar, look for a break above Tuesday's Hi
MRO - look for it to stay above yesterday's high
CHK - buyable if it can stay above 31 and its peers look strong
Posted by
Phileo
at
11:00 PM PermaLink This!
0
comments
![]()
![]()
Thursday's Trades
Closed out NDAQ @35.4 - obviously I was scared into taking profits too soon.
Closed out ILMN@43 - not much worth talking about here, although when it was @43.5, I thought I might have left some money on the table.
ZOLT: bought near the end of the day. Liked the volume, so I bought, and that was that.
ISIS: This was one of Brian Shannon's ideas from (way back) Tuesday.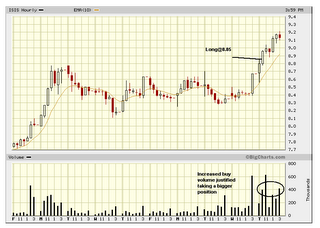
DIGE: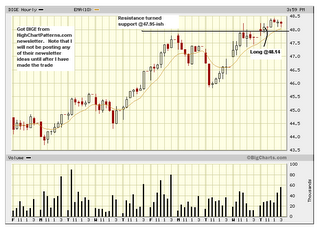
AKAM: the beauty of a small position size is that it compensates for your mistake by making a temporary loss sustainable while you wait for the trade to work itself out. I actually wanted to double down on this when I was watching it during the late afternoon, but fought the temptation.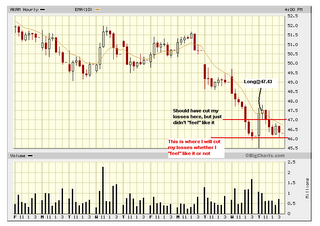
Posted by
Phileo
at
9:59 PM PermaLink This!
0
comments
![]()
![]()
Labels: trades
Trading Self-Analysis
I took a look at some of my recent trades, and boy, do they look messy! First problem is that my losses are all over the place. I've got anywhere from $1 loss to $200 loss. Clearly I need to improve on how I manage risk - think twice about selecting position size and stop loss points. My gut feel says to limit losses to $50 until I increase my equity again.
Second thing that I notice is after that blow up on Google options, my win rate has gone downhill. I think this is a combination of poor trade selection and poor risk management.
So, the second thing to focus on is trade selection - I need to be constantly vigilant about stalking only the best setups.
The third thing that I've noticed in my trading in general is that I haven't held longer than 2 days on most of my trades. I would love to hold a stock for a month and am always on the lookout for a stock that is making a run like how AKAM did back in Sept, or AAPL for the last 2Q's of 2005. However, my trades are suggesting otherwise. Sometimes I feel like I am a scalper, but on the hourly timeframe. I don't know, is there a technique that would allow me to capture all of AKAM's run in Sept? Or all of STEC's run in Aug-Sep? There were plenty of shake-outs as each stock grinded its way higher. With the way I have been trading for the past month or two, I would have surely gotten stopped out of these kinds of run-ups. It goes back to the burning question that I have asked in previous posts - focus on the trade/setup/process, or protect profit with tight stops ? Just some things to ponder, I guess, as I endeavour to find my own answer that works for me.
One other thing that I noticed with my trades - they are all longs ! Just like how traderZBS is comfortable with anti-trend plays, in all honesty, I have a natural preference to be in a long position instead of a short position. Case in point was this morning when SU presented a nice juciy short scalping opportunity: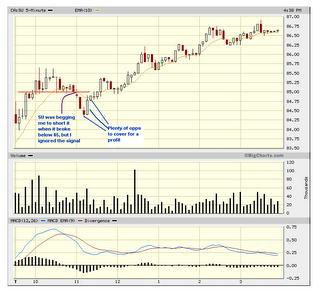
Obviously I need to start learning how to short and short profitably if I am at all serious about eventually doing this trading for a living. So much to learn and so little time...... Fortunately, I enjoy learning (but not the paying tuition part of course!), and still am determined to learn to do this well.
Posted by
Phileo
at
9:33 PM PermaLink This!
2
comments
![]()
![]()
Labels: bigger Picture
Market update
My first post during market hours - whooHoo!
During the first 45 minutes after this morning's market open, you literally could have randomly thrown a dart at the board and blindly pick any stock to go long and it would have worked for you. But only for the first 45 minutes - after that, it was back to the regular chop mode that we've been seeing in the past month or two.
Everyone and their grandma's dog are all over AAPL, so of course it should start fading that huge gap-up.
After observing today's market action, I feel the need to make a comment later tonight about my observations of my own trading habits - and traderZBS's ATR strategy.
Posted by
Phileo
at
11:54 AM PermaLink This!
0
comments
![]()
![]()
Wednesday, October 18, 2006
Thursday's ideas
I have accumulated 14 alerts on 14 stocks that I am watching, and none of them went off today. That was a first! At first I thought maybe some of these hopefully will trigger tomorrow, but after reading some other trader blogs, it looks like we're going to chop around for the rest of this week (earnings + options expiration friday).
nrph - buyable now, stop@46.48
brlc - still looking pretty good
brkr - this was brought up originally on AlphaTrends, still looking good now
BBBY - resistance @40.1, might be good for a $1 scalp?
And judging by the limited size of my ideas list, sounds like caution is warranted for the next two days.....
Posted by
Phileo
at
11:59 PM PermaLink This!
0
comments
![]()
![]()
Today's trades
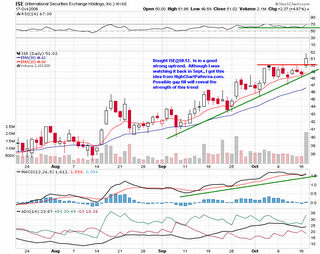
Closed my ISE trade today:
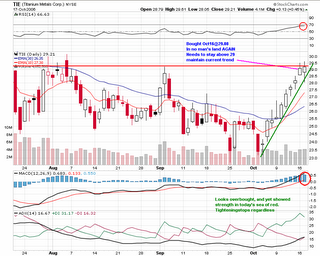
Closed my TIE trade today: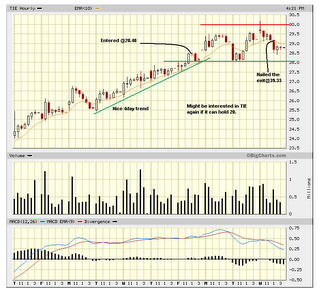
On the NDAQ trade, I took on a bigger position size, but still stayed within my $50 stop rule. The whole sector (ISE, ICE, NYX, BOT, CME) is pretty hot right now given the BOT/CME merger, but the indicators for NDAQ say down. Isn't that great ?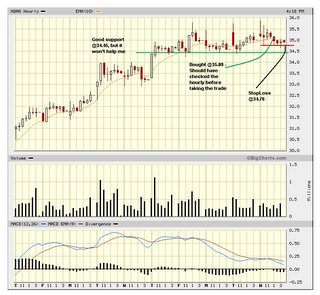
On the ILMN trade, I was fearful of the big gap up, so took a smaller than normal position (plus I wanted to stick to my rules).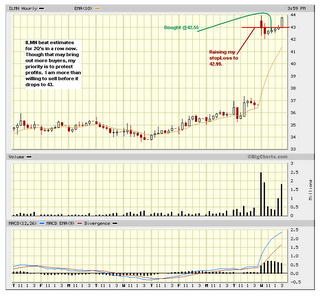 The hourly chart seems to be working out better for me, might stick with that (until it doesn't work).
Posted by
Phileo
at
11:49 PM PermaLink This!
0
comments
![]()
![]()
Labels: trades
Tuesday, October 17, 2006
Ideas for Wednesday
brlc - resistance @6.05
thqi - prevailing uptrend intact, testing 20d trendline
ttwo -prevailing uptrend intact, testing 20d trendline
coh - possible hammer reversal, resistance @36.75
tibx - possible hammer reversal
dbrn - possible hammer reversal
angn - prevailing uptrend intact, testing support@10.25
hurc - inside bar, prevailing uptrend intact
ndaq - support@34.5 and 34.95-ish
Posted by
Phileo
at
11:55 PM PermaLink This!
0
comments
![]()
![]()
Friday, October 13, 2006
All that Matters is Price and Volume.
I recently made a short term trade in my retirement account. It was in a stock called OMG:
If there's one thing that OMG has taught me, it's that sometimes, even the best technical indicators are useless when it comes to certain stocks. Sure, you can pull up 2 or 3 different technical indicators that say OMG is so oversold, but at the end of the day, all that matters is price and volume.
Posted by
Phileo
at
11:15 PM PermaLink This!
0
comments
![]()
![]()
Labels: trades
Thursday, October 12, 2006
Re-Visiting old trades for trade ideas.....
Re-Visiting previous trades and finding out that the stock moved WAY higher after you sold is an aspect of trading that I like the least. It's like the market is teasing, taunting me with these old dogs.
As an example, take a look at BRCD:
Yeah, the market is good at making me regret my early exits.
But now, as mentioned in this article, BRCD is about to take out its 52-week highs. That almost always means there is an opportunity to take up a position in BRCD once again.
Another one is AMR: AMR has a lot of things working in the bull's favour now that it has broken above previous resistance @25. Definitely one to watch in the coming days.
Here are some other old trades that still look like swing candidates in the next couple of days:
Posted by
Phileo
at
8:37 PM PermaLink This!
0
comments
![]()
![]()
Labels: Ideas
No options for me
Well, as I mentioned previously, I was going to look at some Google call options. I bought some and lost a big chunk of change. It just boils down to the cold truth that I don't really understand options well enough to know how to play them without getting hurt. And since options magnify your losses as well as your gains, not following my rules can hurt big time.
Anyways, I spent the last couple of days licking my wounds. Now I will try to erase the pain of this loss from my head and move forward. It's not going to be easy, but I will try. Probably having a couple more trading victories will help.
I've also been trading less frequently for the past couple of days. I'm still prone to breaking my rules, but when I make only 1 or 2 trades for the day, it's harder to find a way to break my rules. Maybe trading less often is not such a bad thing......
Posted by
Phileo
at
8:13 PM PermaLink This!
0
comments
![]()
![]()
Wednesday, October 11, 2006
Collection of Sage Advice
If I can only follow all of the advice laid out here........
- You can trust what you can see, but only for as long as you can see it.
- Do NOT expect, guess nor predict what the chart will do, but WAIT for the chart to show you what it IS doing!
- Better to be stopped out in the green than to hope for green.
- Trade the trade and not the profit, and your equity will take care of itself. (Russ Mascieri)
- If most traders would learn to sit on their hands 50 per cent of the time, they would make a lot more money. (Bill Lipschutz)
Posted by
Phileo
at
10:48 PM PermaLink This!
0
comments
![]()
![]()
Labels: rules
Monday, October 09, 2006
I've been excluded!
Well after all the hype in the past couple of months, Zecco finally launched their commission-free trading platform today. The only problem is that this trading platform is available only to people with a valid American mailing address and US bank account. That eliminates me on both requirements. That is discouraging for me, since I was looking forward to test driving their platform.
Sort of reminds me of Prosper.com as well. They've been running for a couple of years now, and based on various feedback I've read, you can make decent money as a lender on Prosper.com. Unfortunately, they have the same requirements as Zecco in order to be a qualified lender: you need a valid American mailing address and a US bank account, not just a bank account that can handle USD$.
And in keeping with the theme of this post, here is why I've been tracking Google for the past couple of weeks. It got away from me today, but I believe that the problems that Yahoo! reported last month back are specific to Yahoo!. Will be looking at options on Google in the next few days.
Posted by
Phileo
at
11:23 PM PermaLink This!
0
comments
![]()
![]()
Labels: TechTrends
Churn and you will Burn
Last week, my trading was going so well, and then today it's like I had a relapse or something. When today's trading was over, my first thought was, ".... crap, now how am I going to explain this to my journal today??"
Explain what? Well, I turned over my whole portfolio today.
First mistake was that I sold INAP: I sold INAP @16.92 in morning. The reason I sold INAP was because I was watching a couple other stocks and had the urge to chase. Since INAP did not break any support levels, there was no technical reason to sell it. This was a silly mistake, and can't be hidden away.
I also sold STEC@9.04, AKAM@50.87, HGSI@12.86, and RNWK@11.06. RNWK was a clear shakeout, so there was a valid rationale for selling it. AKAM looks like it is now going to test the support level @50, so that was a good time to exit until the dust settles.
In the case of STEC, my stop was set too tight, as STEC rallied back above my exit point and stayed rather bullish for the rest of the day. It was another case of gunning for stops, what can you do? I won't beat myself up over that trade, and will probably look for another setup to get back in tomorrow.
HGSI however, I sold and then bought back@12.98. Selling and then turning around and buying back the same stock is a good indicator that a mistake was made somewhere along the line. This was a simple case of fear and greed. Fear of losing my profits made me sell, and wanting to catch the gain made me buy it back.
What was I chasing that would cause me to dump all my previous positions? There was plenty of attractive candidates to chase today: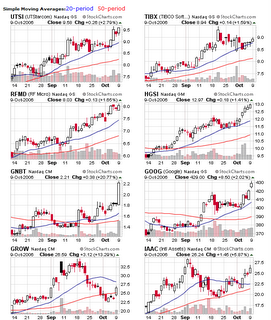
I caught TIBX@8.87, RFMD@7.92, and UTSI@9.49 (I bought back HGSI as earlier mentioned). Watched GNBT all day but couldn't pull the trigger. Got an alert on GROW and later on IAAC, but only then did I start thinking ".... let it go".
It wasn't too long ago when the market was slow and boring. Today was certainly not one of those days (at least not for me), and it's when there is so much happening in the different sectors that it is even more important to keep my emotions in check. Today was proof of the damage that can occur when one's emotions are not under control. There was no financial damage to my equity, but all this churning meant a lot of wasted effort.
Posted by
Phileo
at
10:35 PM PermaLink This!
0
comments
![]()
![]()
Phileo's Pattern Ideas for Tuesday
My scan did not reveal too many interesting candidates, but I find the following interesting:
AIG - potential hammer reversal
TTWO - narrow range bar, potential dummy trade.
COGN - narrow range bar, potential dummy trade
RCL - inside bar, potential continuation breakout
WSH - narrow range bar, potential dummy trade
AMGN - current pullback starting to find possible buying support
Posted by
Phileo
at
10:23 PM PermaLink This!
0
comments
![]()
![]()
Sunday, October 08, 2006
Phileo's Pattern Ideas for Monday
I've done a pseudo-random scan for stocks that match the chart patterns that I've discussed recently, and came up with the following:
COGN - potential dummy trade setup on the daily chart.
MNT - potential hammer reversal pattern showing up.
UTSI - inside bar after first thrust breakout.
THQI - potential hammer reversal pattern; watch peers (ATVI, ERTS, TTWO) for sector trends.
RFMD - potential pullback pattern; watch for the pullback to reverse.
WTSLA - retail apparel sector currently strong, choppy support@6
SYMC - potential bounce off the 20d EMA
Posted by
Phileo
at
5:44 PM PermaLink This!
0
comments
![]()
![]()
uranium
Uranium is the biggest bull market that is still not known to the retail and even many institutional investors. The upward movement in spot uranium price in the past 2 years rivals that of a certain bulletin board stock. Unfortunately, there is currently no American security available for investors to participate in the uranium bull run. However, there is a Canadian uranium ETF available which operates in a manner similar to the other commodity ETF's like IAU, SLV, and USO. This Canadian ETF is call Uranium participation, and it trades on the TSX exchange (ticker is TSX:U). Interestingly enough, unlike the other commodity ETF's, U does not yet track the spot price of uranium. This could be due to the fact that it trades only in the Canadian market, and the ETF is priced in Canadian dollars, which means there will be Forex fluctuations. Given the continued bullish outlook in uranium, I will be looking to add to my position in U for my retirement account this coming week.
Posted by
Phileo
at
5:33 PM PermaLink This!
0
comments
![]()
![]()
Labels: uranium
The PullBack pattern
Okay, I wanted to follow up on Trader:R's comments yet again about playing the pullback vs. playing the breakout.
What is the PullBack pattern?
There are variations of this (I think Dave Landry devoted a few chapters of his book to this pattern that he pioneered), but essentially, a pullback is a stock that is temporarily moving in the opposite direction of its prevailing trend. A pullback that breaks an established support/resistance level could develop into a break of the prevailing trend. However, if the support/resistance level holds up, or the pullback reverses, then that presents a very high probability, low risk entry. That is the essence of the pullback pattern - finding the low risk entry point into an already trending stock. An example best illustrates this: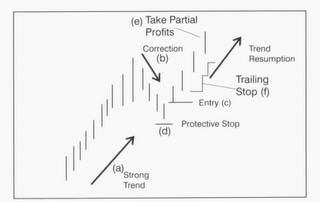 And a more realistic (and recent) example:
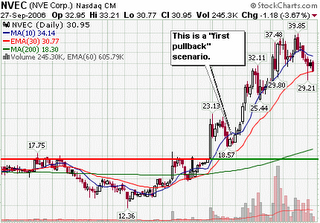
Characteristics of the pullback pattern:
1. There is declining volume during the pullback, meaning that the wave of selling is weaker than the previous wave of buying.
2. Various candlestick patterns indicate signs of a possible reversal from the pullback.
3. Pre-existing prevailing trend
The time to enter a position is as soon as the stock tells you that it is reversing from the pullback.
One variation of this pullback pattern is the first pullback after a high volume breakout or break to new highs/lows. In this case, the reversal of this first pullback is even lower risk than the normal pullback pattern because the reversal of this first pullback is the first confirmation of the trend. After this, many more institutions/traders are typically drawn towards this stock.
What makes this pullback pattern work so well is that you are buying when the herd is selling (just before they realize that they should be buying instead of selling!)
As I've mentioned before in my followup about the breakout pattern, playing the breakout or playing the pullback are both equally valid strategies. So when should you play the breakout, and when is playing the pullback better? I don't know the answer to that, and this is where it becomes more art than science.
Posted by
Phileo
at
12:11 AM PermaLink This!
0
comments
![]()
![]()
Labels: Pattern Catalog
Friday, October 06, 2006
A Good week
Not too much acitvity on my part for today, which must mean that I'm actually following some of my rules.
I made one sell and one buy today.
The one sell was on UTSI: I sold UTSI @9.35. If I had a better entry price, like say at 9.01, then I would have probably kept the stock instead of selling it. But since I bought in no man's land (@9.28, which I neglected to mention in yesterday's post because I was so tired....), so I'm not too surprised at this result. Upon reviewing the chart after the close, I find UTSI retraced about 50% of its breakout yesterday. So, from these levels, it's actually looking somewhat healthy and might be a candidate for re-entry. We'll have to see how it behaves on Monday.
The only stock that I bought today was HGSI: I bought HGSI @12.85. As I mentioned yesterday, HGSI was a choppy stock and sure enough, after I bought it, the breakout failed and it dropped to a lower price level. But since it did not drop below my initial stop @12.59, and today's price pattern looks a bit encouraging, I have decided to continue to hold it.
So now I hold 5 stocks in my trading account:
AKAM
HGSI
INAP
RNWK
STEC
Posted by
Phileo
at
11:45 PM PermaLink This!
0
comments
![]()
![]()
Labels: DailyReview
Housekeeping stuff
I made one buy and one sell today (which I'll talk about later in a separate post), and since I've kept most of my positions from the previous two days, I won't be making any more trades. Sure wish I had more money so that I could buy some more stuff, another one of Brian's picks is doing well today - CMED.
I was pretty tired yesterday, so my review of yesterday's trades may not have sounded very coherent. If you've ever tried typing while your head is bobbing up and down, and you're fighting the temptation to give into Mr. Sandman, then you'll know what I mean.
Anyways, I have been tracking my performance on a spreadsheet, and have been experimenting with putting it up on Google spreadsheets so that I can link to it on this site. However, it seems that Google Spreadsheets still has some bugs to work out before they can be used reliably. When I tried to view after I uploaded my spreadsheet, it showed all these garbage characters that are repeated in certain groups of cells. I've emailed them for tech support, and we'll see how it goes. I may use something like box.net to host my spreadsheet if this does not work out (or if any of you have suggestions, leave a comment).
As you can see my trading journal is still a work in progress, and up until now, I really haven't given too much thought to improving traffic to my blog, getting traffic stats on my blog, etc.. I wrote that piece on cataloging the high chart patterns just because it made so much sense to me, not because I wanted to get someone's attention (ok, well, I do, but I honestly didn't start out with that goal in mind when I wrote that piece). But I noticed what I wrote seemed to resonate with a few of you, as that piece made it to become TraderMike's most popular outgoing link for at least the one day after I wrote it! Thanks everyone! I'm honored, gratified, and humbled at the same time. But I don't have anything exciting articles in store to top that (at least not for the next week or so). Just the usual boring stuff, like getting the rest of my trading plan written down, maybe talk a little more about my system, figure out the best way to post/link my spreadsheet, yada, yada, yada, yada. I needed to say that now, in order to temper everyone's expectations, including my own. First and foremost is to reduce my mistakes, that is my stated goal, and it was the reason why I started this journal. Documenting the high-probability setups helps accomplish that goal because it helps me to focus on selecting better quality setups, and better setups helps to reduce my mistakes.
I've also been thinking about moving my blog onto WordPress. Despite the many Web2.0 whiz-bang bells 'n whistles that Blogger added to their blogs, it still can't do certain key things (like upload spreadsheets, splitting up my post into pages, more flexibility in comment moderating, etc.). Web hosting providers in my area cost around $10-20/month, getting my own domain costs about an extra $1/month. Just hemming and hawwing as I figure what is the best course of action.
Posted by
Phileo
at
7:19 AM PermaLink This!
0
comments
![]()
![]()
Thursday, October 05, 2006
Hidden mistake
My last trade today was UTSI:
UTSI was another one of Brian's trade ideas. My trade in UTSI did not make use of any good setups, so this can be considered a mistake (not waiting for the best setup, and buying after the stock broke out, and NOT following my plan). Initial stop was set to 9.1, but I have since moved it up to 9.38.
The market had such a bullish tone today, that it made up for my mistake.
I guess this was a reminder that I'm still not quite ready yet to trade for a living....... hmmm.......
Posted by
Phileo
at
11:56 PM PermaLink This!
2
comments
![]()
![]()
Labels: screwUps
A WhoopDeeDoo day
I made three trades today.
First one was RNWK: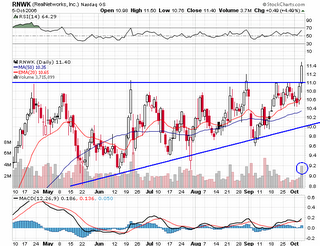 I first heard about RNWK from Brian shannon's daily video review. Bought RNWK when it comfortably broke above the 3rd 15-min bard, @11.05 with the initial stop @10.8. This trade made use of the breakout pattern. But what I liked about it was the build-up of buying pressure for the past 2 months or so. It made a series of higher lows during that time, which is a good sign. I think we're seeing alot of these breakouts because of the renewed bullish sentiment in the market. Some significant money came into the markets today, and these frequent breakout occurences are a sign that the big money moving in.
Today's action was very bullish, so I moved my stop up to 11.29.
Next trade was stec: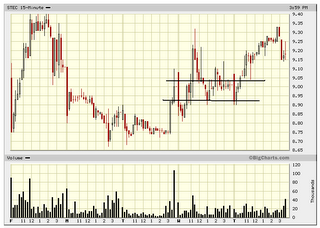 I bought at around the upper black bar, @9.02. The initial plunge never made it to yesterday's low - in fact you can see a double bottom @8.91. That is also where I set my initial stop loss. STEC has the potential to make another MoMo run for the remainder of this month. I could live with that.
Posted by
Phileo
at
11:19 PM PermaLink This!
0
comments
![]()
![]()
Labels: trades
Wednesday, October 04, 2006
Light at the End of Chop Tunnel?
I've held onto most of the trades that I made yesterday, with the exception of AMR. That stupid AMR, gapped down below my stop loss, aargh! I was glad to get rid of it @24.3, let someone else fall in love with it.
Only made two trades today, although I certainly felt the urge to chase many more.
First up was RFMD: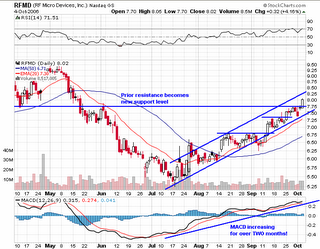 I bought RFMD on a break above prior resistance @7.8. I was a little bit worried about that gap left behind yesterday. But the stock did not try and test yesterday's lows even after the first hour. In fact, the stock behaved well all day - no chopping around, no temporary spike below the trendlines like in the next buy that I made.
This was my next trade: I entered @12.32, with a stop @12.23. I didn't like what I saw an hour later, and bailed @12.29, before it even dropped to my stop. I've been trying to avoid trading intraday, but sometimes you just can't avoid it when you're dealing with choppy stocks. Looking at choppy stocks (such as HGSI) provides fuel for the argument that the MM's are manipulating stock prices intentionally in order to take out stops. Compare that with the 5d picture of RFMD:
 There's certainly a case to be made in trading stocks that behave .... less choppy? Especially in the choppy markets of September.
Posted by
Phileo
at
9:40 PM PermaLink This!
1 comments
![]()
![]()
Labels: trades
Today's Trades
I made 3 trades today (excluding the exit of my BRCD position prematurely).
First up was BBBY:
My trade in BBBY does not fit any of the high probability patterns unless you consider this a breakout (despite the avg. volume). So what did I see that made me want to buy it? It was the attempt to test yesterday's lows - this stock never even came close to yesterday's lows before building a series of higher lows. The action was well behaved, all the indicators were in agreement, low risk, and encouraging, so I took a shot at it. Bought @38.58 with initial stop@38.2. I will study this chart in the future to see if there is a high probability pattern somewhere in there.
Next up was AKAM:

My trade in AKAM made use of the dummy spot pattern. Like BBBY, AKAM was above the trendlines, trend was (and still is) up, low risk in the narrow range bars, volume was better than yesterday, the shot was there and I took it, bought @50.78, with initial stop @50. Sounds like the risk is quite big, but however, I like how AKAM is in a strong uptrend, and today could mark the resumption of that uptrend. We shall see tomorrow.
My last trade was AMR: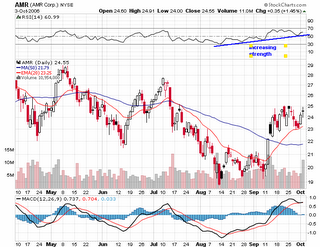 Like BBBY, my trade in AMR also did not make use of any of the high probability patterns. In retrospect, I probably should not have taken this trade, and should have waited more patiently for the break above 25. I remember now, I got sucked in by that series of narrow range bars during midday. I entered on the break above those narrow range bars @24.68, with initial stop @24.45. Oh well, 2 out of 3, you can't win them all!
Posted by
Phileo
at
12:43 AM PermaLink This!
2
comments
![]()
![]()
Labels: trades
Tuesday, October 03, 2006
Follow up on BRCD
Crap, got too scared and shaken out of my position in BRCD this morning, sold @7.42.
It was quite a dilemma (at least while I was watching this morning plunge) - protect profits, or keep stops loose ?
I wish I could claim ignorance but I've read about this before on other blogs and trading articles - tinkering with your stops just leads to weeping and gnashing of teeth. This is a variation on my rule about patience - set your stops and let the market decide whether to take out your stops or not !
I would have been better off not watching my positions after I made an entry and set my stops.
Anyways, that's something I need to work on for sure - learning when is the right time to sell !!
Posted by
Phileo
at
10:05 PM PermaLink This!
0
comments
![]()
![]()
Labels: screwUps
Monday, October 02, 2006
More on the Breakout pattern
Based on the comments of Trader:R, I thought I would expand a bit more on the breakout pattern. Just like how some gap ups often get filled, breakouts often get tested. You can play the breakout, or you can also play the test of the breakout, both choices are perfectly valid. But for the purposes of this pattern catalogue, the point I want to make is that the breakout is a high probability setup. Why? The volume provides the "juice" to turn prior resistance into the newest support level. All the bagholders that were stuck at that prior resistance level have now been removed - there is literally no more resistance (at this level), and that in turn attracts new buyers to jump aboard to drive the stock up.
Now, there are a couple other ingredient that I failed to mention about the breakout pattern.
1. The breakout pattern works best when the breakout is in the direction as the trend. In the example that I used, GD was above the 200d, 50d, 20d MA's. All the MA's were trending up. The trend is your friend, yada, yada, yada. This is also consistent with the Chairman's dummy Trading questions (is the trend up or down?). When the stock moves in harmony with the trend, that is when you get your high probability setup.
2. There is no gap up from close of the previous bar (yup, starting to think timeframe-less here). The opening price must be below the previous close for this breakout to work. That's because gaps tend to create a different behaviour in the stock, and that may negate the effectiveness of this breakout pattern.
Going back to the example of GD, the buystop would be just above the resistance level @69.9 (or the psychological resistance @70 if you wanted to be safe), initial stop would be just below the previous day's close @69.25-ish. After the breakout, how you manage your stop depends on whether you want to play it tight or loose - this goes back to your own risk tolerance. Once there was follow thru buying the next day, one possibility would be to move the stop to the next day's low@71. Or if you wanted to play it loose, just move the stop up to just below the new support level@70.
Posted by
Phileo
at
10:57 PM PermaLink This!
0
comments
![]()
![]()
Labels: Pattern Catalog
Thoughts of a Newbie
I had previously mentioned that I have been investing for 6 years. The long and winding road to the present day started with Fundamental Analysis, of course. Then came TA. But I wasn't get much better results with TA, so then came the more focused approach, which only really started earlier this year. I've read a couple of swing trading websites which helped me along the way, and then of course, stumbling across TraderMike's website and his whole network introduced me to the idea of dummy Trading.
Clearly I still have much to learn about swing trading. I haven't really given any thought as to the best way to organize my learning. Sure, there are learning priorities, such as stop making mistakes. (Those traders who have managed to get past the hump of self-destruction definitely has my admiration!). I still have to get in the habit of reporting my trades in terms of R. There's a whole laundry list of things I want to do. So, this trading journal will additionally serve as an exploration of sorts, to experiment with what kind of learning structure works best to improve my trading.
The latest manifestation of the learning structure that works for me is my idea of cataloguing the high probability patterns. The more I think about it, the more I like this, as it helps me to bring a new focus to my trading approach. It's obvously still a work in progress, so I will make more detailed posts on that topic as I learn more insights.
Posted by
Phileo
at
9:11 PM PermaLink This!
0
comments
![]()
![]()
BRCD!
My trade of the day today was BRCD:
Pretty self explanatory. This trade made use of the dummyspot pattern. The upper blue bar represented my buystop (basically above the narrow range of the previous 2 bars), the lower blue bar represents my initial risk (just below the same narrow range of the previous 2 bars).
Posted by
Phileo
at
9:01 PM PermaLink This!
0
comments
![]()
![]()
Labels: victories

 BlogLine This!
