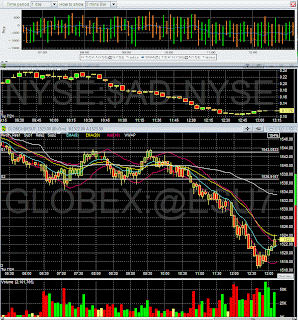
3 Trend days since July 24/07. Going forward, I will be tracking them all here.
Read Full Post.....
Starting from July 24, The first one was on July 24:
notable characteristics:
- previous day was a (relatively) narrow range, low volume day
- trend duration was just over 3hrs starting from 930a
- no 100% retracements after impulse moves. The biggest retracement was after the first impulse move, which retrace about 75%
- market opened gap down -10. Initial attempt to fill the gap produced a double top failure. Reversal triggered the trend.
- if you had entered short any time before the third hour of trading, you would have to suffer up to a 9 point retrace. The real Trend did not really start in earnest until after the third hour.
To avoid a 9point initial stop, you would have to recognize in real-time the formation of the double topping pattern. There were two low risk entries:
The first was when price reversed the second time at 1543.5, enter at 1541. The second Low risk entry was on the high volume breakdown below support at 1536.
The next one was on July 26:
notable characteristics:
- The biggest retracement was just before the final impulse move. There was a 83% retracement of the middle impulse move.
- 20MA was not broken for more than 2 candles.
- previous day was a high volume, choppy, range bound day
- trend duration was at around 4hrs, and accelerated in the afternoon
- market gapped down -12 to open, and the trend came from a failure of the initial attempt to fill the gap.
- if you had entered short any time before the third hour of trading, you would have to suffer up to a 9.5 point retrace. Trend did not really start in earnest until after 8am (PST).
There were two low risk entries:
The first was to observe the attempted gap fill, and enter on the reversal at 1512.
The second was on the high volume breakdown out of consolidation at 1506.
A borderline trend day on July 30:
notable characteristics:
- if you had entered any time before the first hour of trading was complete, you would have to suffer up to a 12 point retrace. However, if you had entered any time after the second hour of trading, you would only have to sit through a maximum 66% retrace. The moral of the story - it pays to be patient for a trend to clearly establish itself.
- there wasn't anything special that happened in the previous session which indicated even a hint of a trend day.
- market dropped 8pts in the first 10min. but then reversed for an equally impressive recovery. A subsequent test of the LoD reversed and started the trend in earnest.
- the real trend did not occur until after the third hour of trading. After that, the 20MA started trending up for the remainder of the day and was never violated.
- 19pt move over the course of 3.5 hrs.
There were three low risk entries:
The first was the reversal at 641am, enter on the break above 1464.
The second was the reversal after the double bottom was put in at 1461, enter on the break above 1463.
The third and last low risk entry to catch this trend was the break out of consolidation, enter at 1466.
DailyReview (123)
futures (108)
futuresTrading_Plan (73)
MarketReview (66)
trades (56)
uranium (47)
swing (46)
victories (42)
Ideas (40)
bigger Picture (40)
screwUps (35)
OffTopic (34)
options (34)
chartReview (30)
LearningCurve (22)
Pattern Catalog (14)
sectors (13)
rules (9)
TechTrends (8)
Euro (7)
daytrades (7)
trendDays (7)
MonthlyReview (6)
ProductReview (5)
Trading System (4)
Followers
Friday, August 03, 2007
Tracking Trend days
Posted by
Phileo
at
11:18 PM PermaLink This!
![]()
![]()
Labels: trendDays
Subscribe to:
Post Comments (Atom)
 BlogLine This!

No comments:
Post a Comment